Analytics
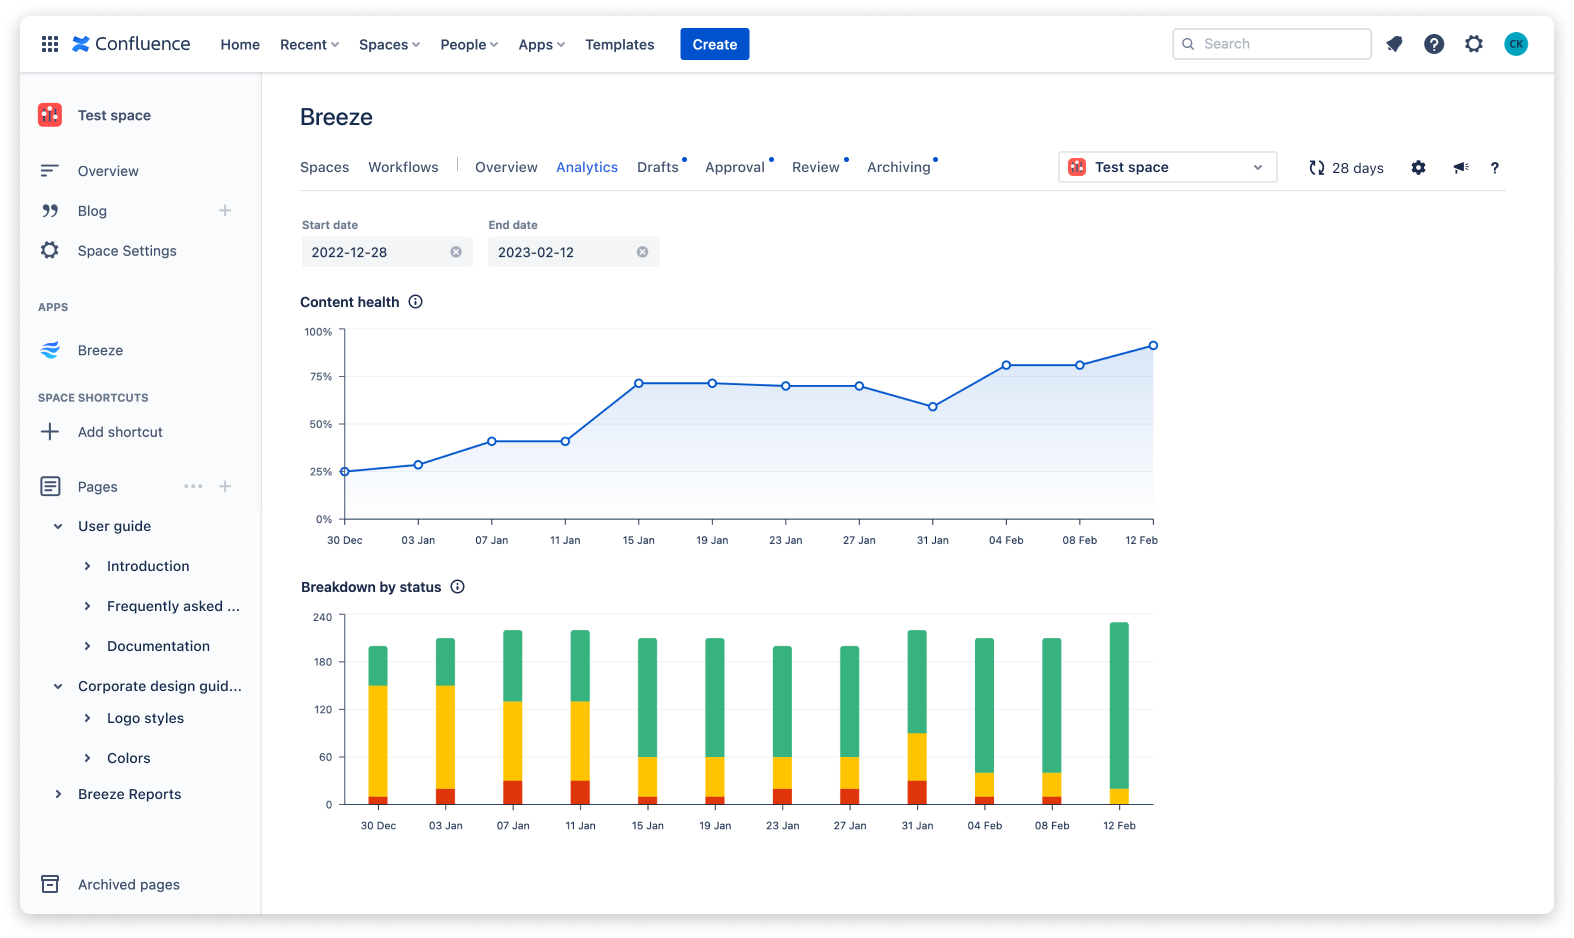
The Analytics component helps you analyze the outcome of your content management efforts. It shows two graphs for a selected time frame, as shown in the image below.
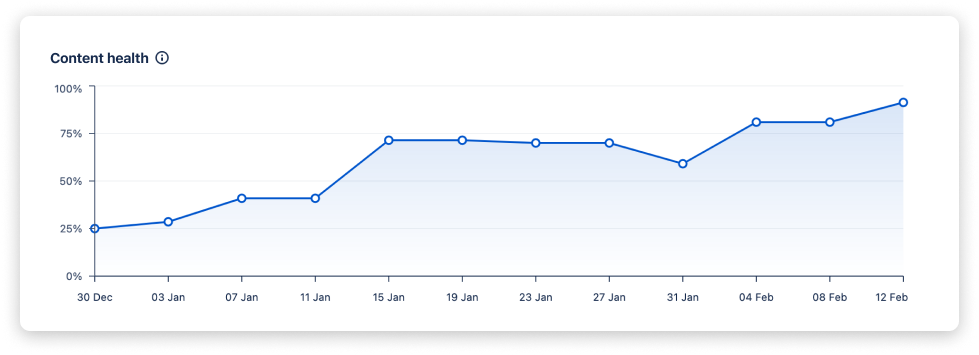
Content health graph
Section titled “Content health graph”The content health graph visualizes the content quality of a selected space over time.
The content quality or health is defined as the proportion of pages marked as UP TO DATE in relation to the total number of pages analyzed (not taking into account pages with the status DRAFT, IN APPROVAL, and EXCLUDED pages).
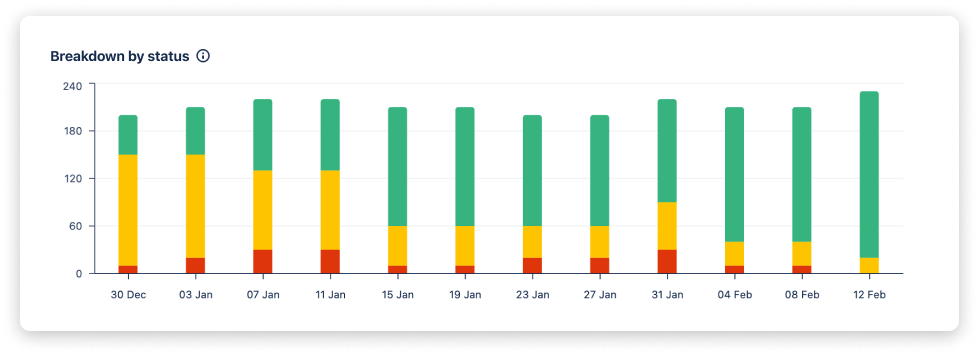
Breakdown by status
Section titled “Breakdown by status”This graph visualizes the distribution of pages and their status over time.