Evaluating a survey
Overview of results
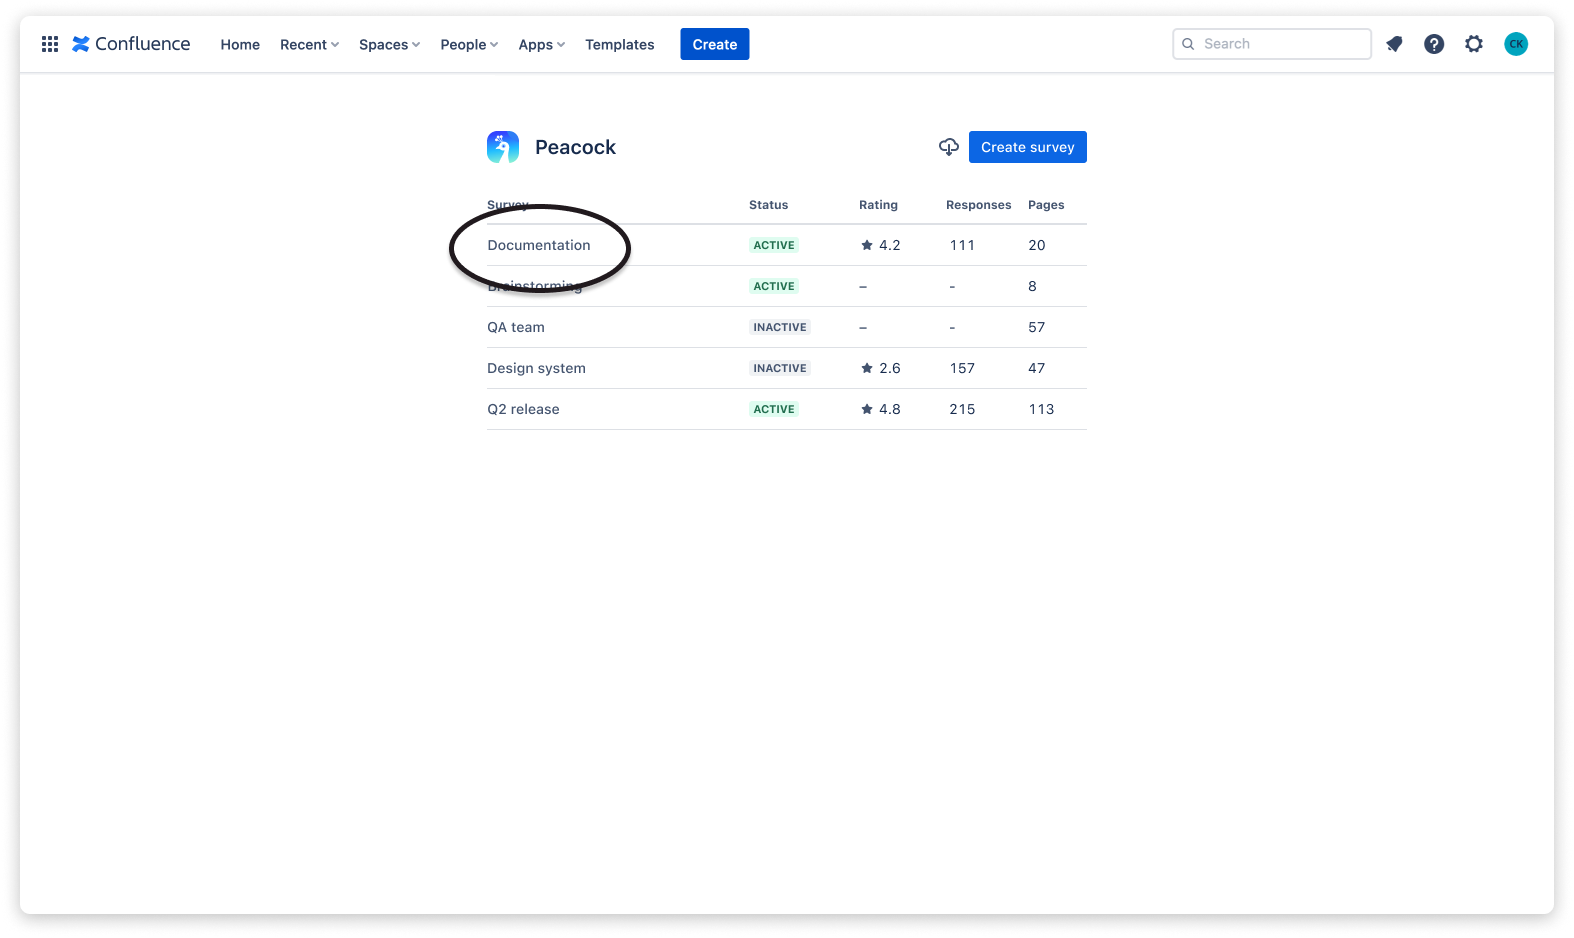
Section titled “Overview of results”When opening Peacock from the Confluence apps menu, you will get an overview of all surveys and the most important metrics:
- the status of the survey,
- the average rating of all pages taking part in the survey,
- the number of responses,
- and the number of pages.
While the overview allows you to compare the results of various surveys on a higher level, you can also deep-dive and further evaluate the results of a particular survey by clicking its name.
Survey details
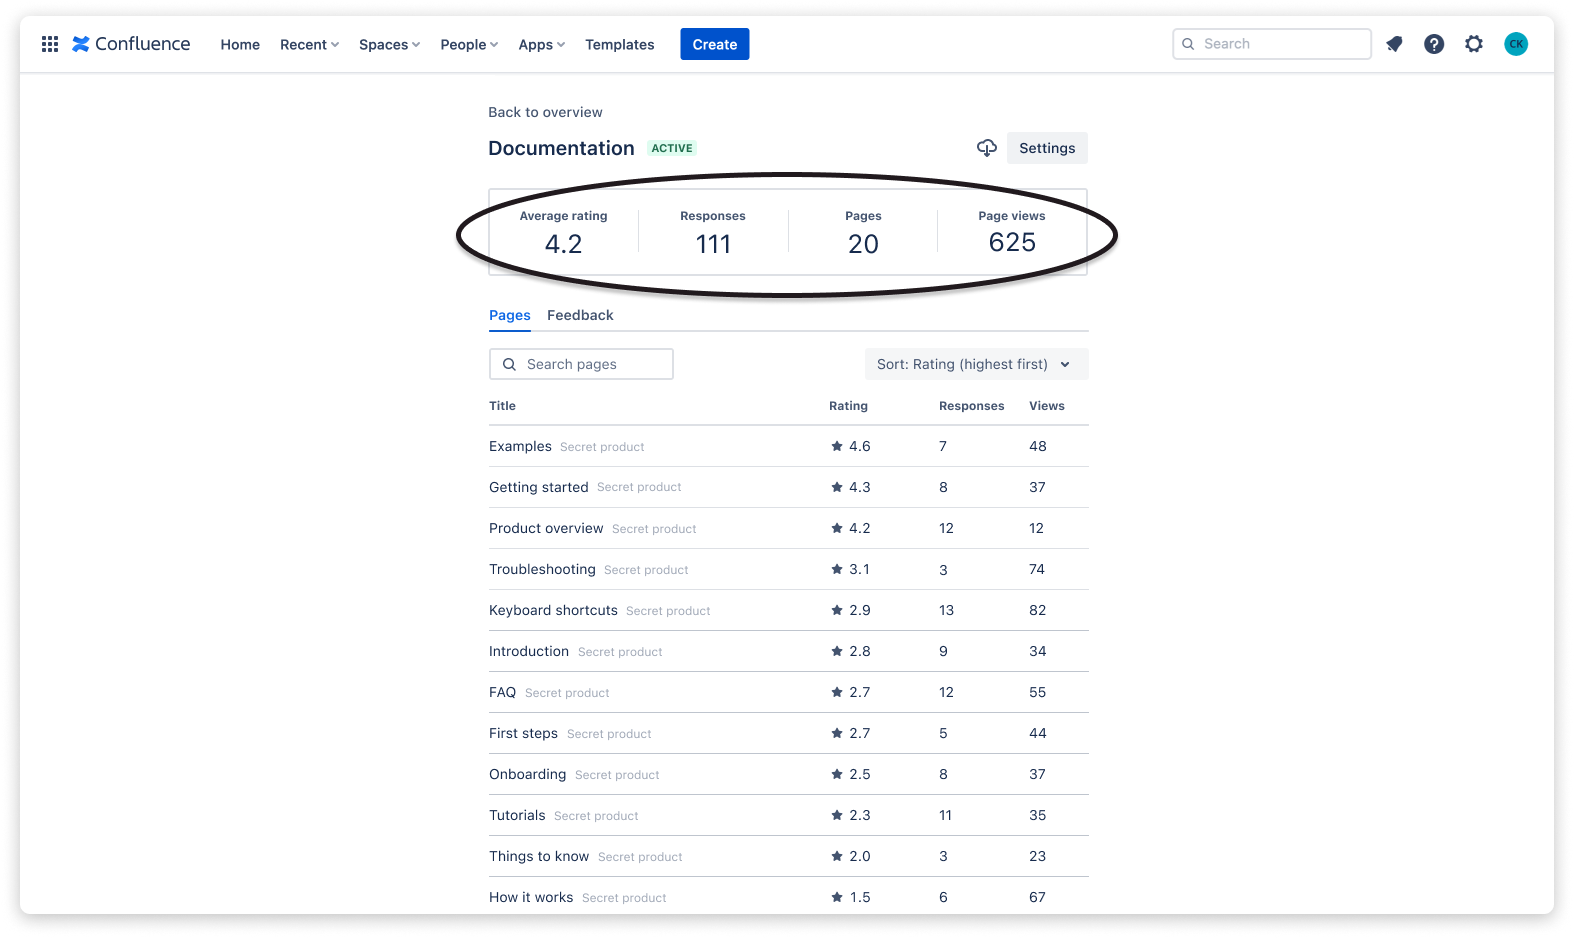
Section titled “Survey details”At the very top, the details view of a survey shows its most important metrics:
- the average rating of all pages taking part in the survey,
- the number of responses,
- the number of pages,
- and the number of page views for all pages contained.
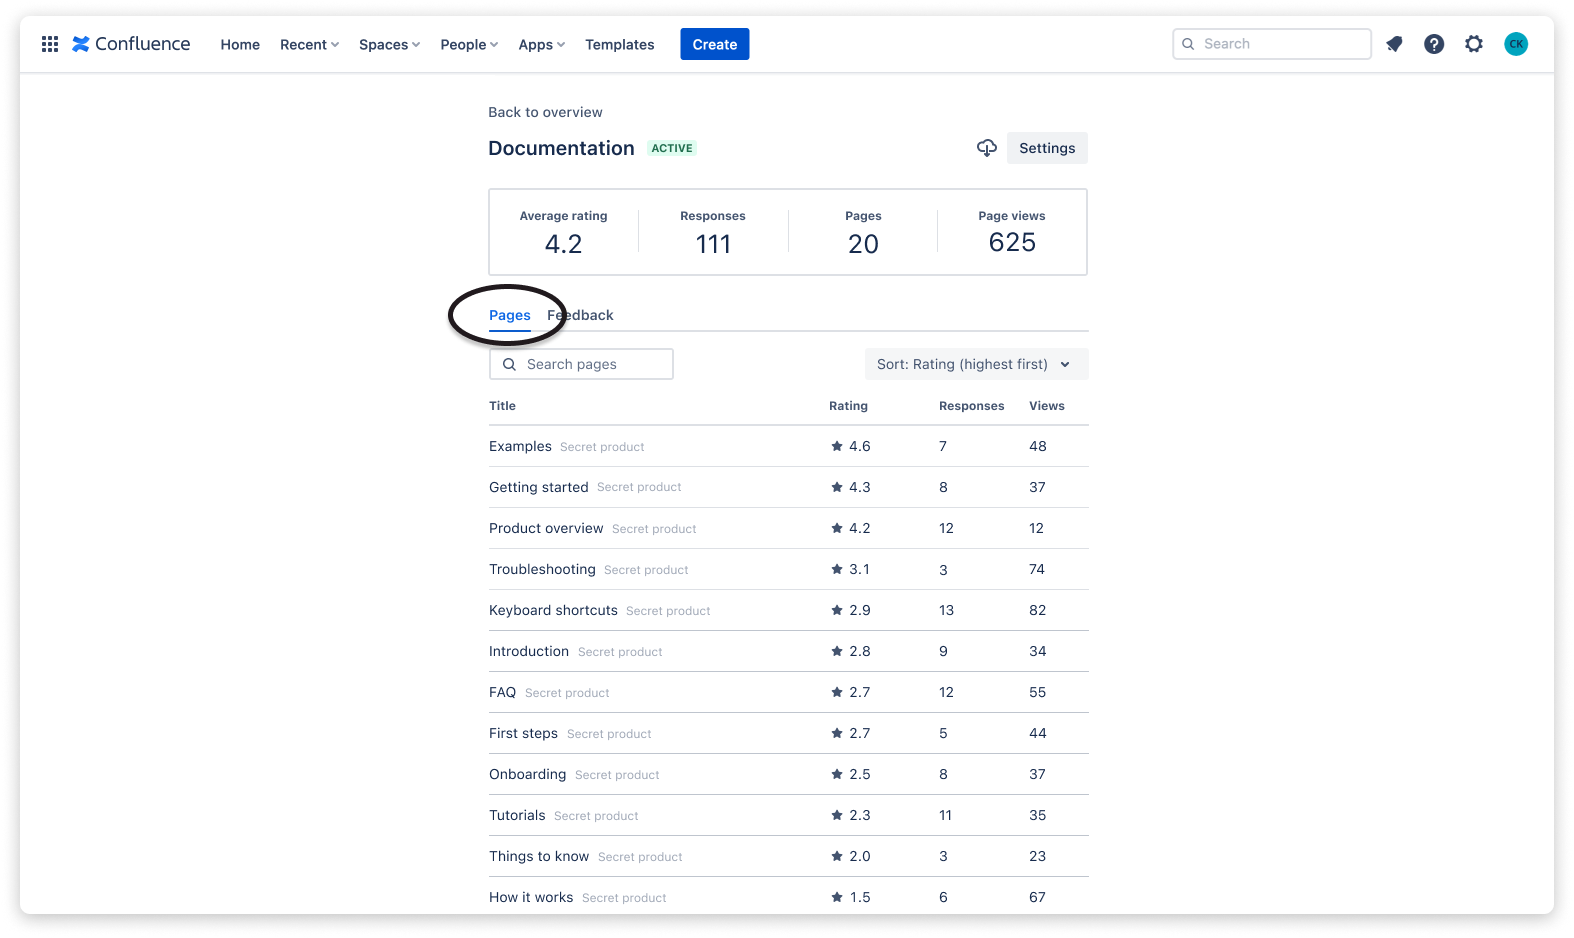
Below, the pages tab lists all pages contained in the survey, which can be sorted by rating (highest / lowest) or number of responses (most / fewest).
The feedback tab shows a list of feedback collected by the survey. It can be sorted by date (newest / oldest) or rating (highest / lowest).
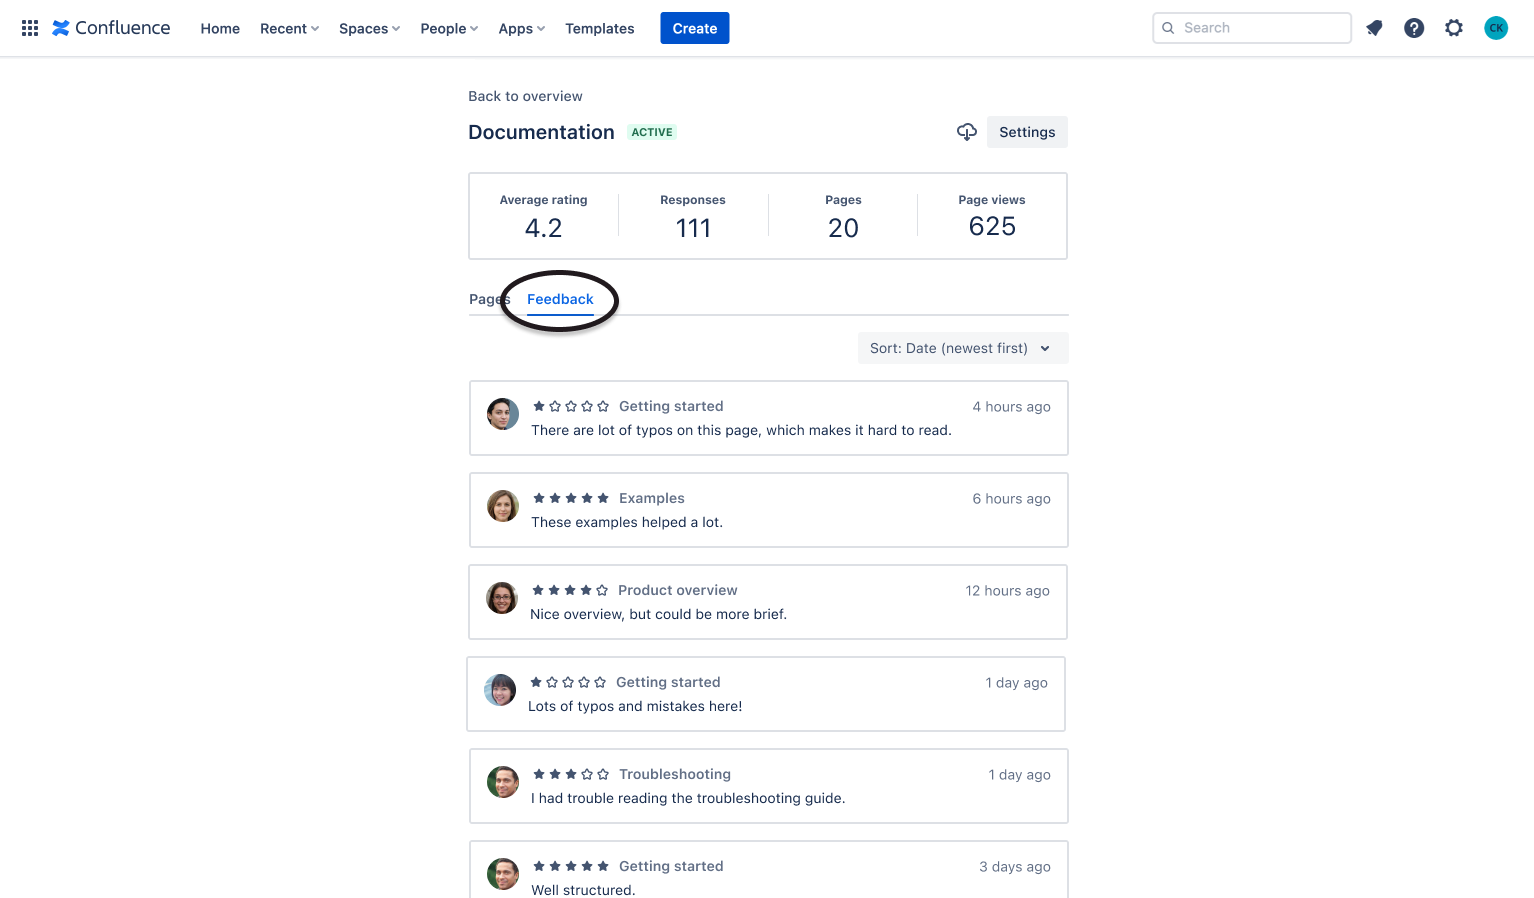
Clicking a page title in the pages or feedback tab will open the page details.
Page details
Section titled “Page details”The metrics section on top shows:
- the average rating calculated from all feedback collected from this page,
- the number of responses,
- the number of unique viewers,
- and the number of page views since the survey started.
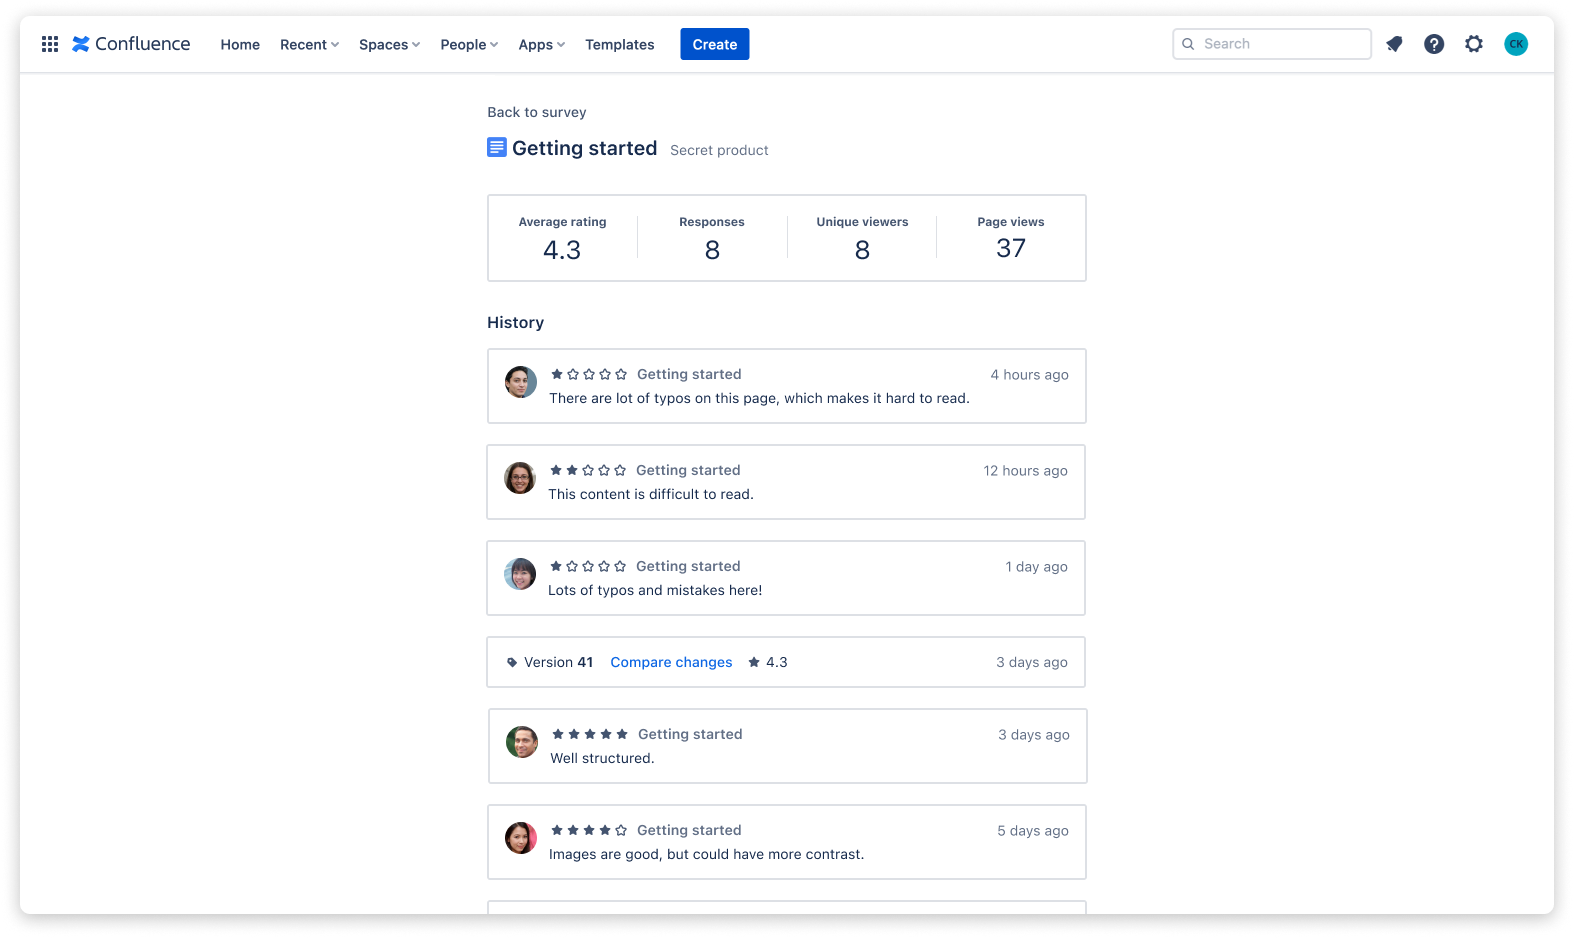
Below the metrics is the feedback history, which is grouped by versions, allowing you to correlate the feedback given to the page with the page content.
☝️ Please notice: Clicking the page title at the very top will open the page in Confluence.